
Family conflict can look very different on a holiday than it does during an ordinary week. Exchange times, travel plans, money, and time with children can all become subjects of disagreement. Our study of Holiday Family Conflict in America examines reported partner assaults and intimidation on four dates in 2025.
Dellino Family Law analyzed FBI National Incident-Based Reporting System records for New Year’s Day, Halloween, Thanksgiving, and Christmas. We compared participating U.S. jurisdictions and Washington, then measured each holiday against similar nonholiday days. New Year’s Day had the highest reported rate nationally and in Washington.
The police data covers reported partner assaults and intimidation. We also reviewed parenting laws, Census support figures, and research on children and family communication to examine other pressures that can affect separated families during the holidays.
New Year’s Day Has the Highest Rate of Reported Partner Violence
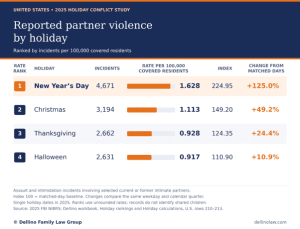
New Year’s Day showed the highest rate of violence. Participating agencies recorded 4,671 qualifying incidents, or 1.628 per 100,000 covered residents. That rate is 125.0% above the average on matched non-holiday days, meaning New Year’s Day recorded about 2.25 times the comparison rate.
According to our analysis, there were 13,158 qualifying incidents in jurisdictions covering 286,966,372 residents. That reporting cohort represented 84.0% of the U.S. population. Each count equals one incident. The total number does not tell us how many unique people or families experienced violence.
The national results show both the rate on each holiday and its change from comparable days:

Christmas ranked second, followed by Thanksgiving and Halloween. Of the four holidays, Halloween had the lowest observed rate on a national level, though the number of reported incidents was still above its own matched-day baseline. The results describe these individual dates rather than the weeks surrounding them.
The matched-day comparison shows how each holiday differed from similar days during the same part of the year. Christmas, for example, recorded 3,194 incidents and a rate 49.2% above its baseline. That distinction separates the number of reported incidents from the size of the holiday increase.
Washington’s Holiday Pattern
Washington was in line with the national results, having recorded its highest rate on New Year’s Day, with 77 incidents and an increase of 74.3% over matched days. Our Washington state analysis included reporting from agencies that covered 93.0% of the population.
Additional context for the statewide results comes from the Washington Association of Sheriffs and Police Chiefs statistics. The Holiday Partner Assault and Intimidation Index is based on FBI incident archives.
The other observed holidays appeared in a different order from the national comparison:
Thanksgiving ranked second in Washington, ahead of Halloween and Christmas. Christmas had the state’s lowest holiday rate, and Halloween had its smallest relative increase. These are separate comparisons: a holiday’s reported rate describes the level of incidents, and its percentage change describes how far that level was above its own baseline.
What the Index Counts
There are three FBI offense categories in our Holiday Partner Assault and Intimidation Index: aggravated assault, code 13A; simple assault, code 13B; and intimidation, code 13C. Linked records are required to have identified a current or prior intimate-partner relationship. Both attempted and completed offenses are included, and each incident appears once in the combined measure.
The offense breakdown shows why that last step is necessary. Nationally, New Year’s Day included 4,081 assault incidents and 594 intimidation incidents. Those figures add up to more than the combined total of 4,671 because an incident can involve both assault and intimidation.
We looked at each holiday and selected non-holiday dates within the same calendar quarter that landed on the same weekday. An index score of 100 equals the baseline; 150 means 50% above it. Scores can go over 100. The comparison accounts for weekday and quarterly patterns, but it cannot explain why an incident happened or prove that a holiday caused violence.
How Reported Holiday Partner Violence Varies Across States
The national totals hide substantial differences from state to state. Comparing eligible states shows how widely reported partner-assault and intimidation rates varied across the jurisdictions represented in the study. We ranked eligible states using their combined incidents on January 1, October 31, November 27, and December 25, 2025, per 100,000 covered residents.
A state is qualified when included agencies covered at least 80% of its population and reported at least 50 qualifying incidents across those dates. Thirty-two states met both requirements. The threshold keeps states with limited reporting or very small incident totals from being ranked alongside states with much broader data.
Nevada had the highest observed eligible rate, at 9.434 incidents per 100,000 covered residents. The ten highest rates were:

These figures cover four dates within one year. They are not annual rates, four-year rates, or rates among parents. The rate is based on all residents covered by participating agencies, not only parents. The police records also do not establish that the people involved shared children.
Washington Had the Fifth-Lowest Eligible Rate
Washington ranked 28th among the 32 eligible states. Its 239 qualifying incidents produced a four-date rate of 3.212 per 100,000 covered residents, approximately 29.9% below the national reporting-cohort rate of 4.585.
The five lowest eligible rates were Michigan at 2.536, Massachusetts at 3.034, Utah at 3.035, Minnesota at 3.176, and Washington at 3.212. Washington’s lower ranking applies only to the reported assaults and intimidation captured on these four dates. Other forms of domestic violence, unreported incidents, and the circumstances of an individual family fall outside that ranking.
All 50 states and D.C. remain in the underlying data. Jurisdictions that failed to meet the ranking requirements remain unranked, which does not mean they recorded no incidents. Differences in reporting and violence that never reaches police can also affect the picture.
How the Holiday Pattern Differs for Former Partners
A closer look at former partners changes the holiday order. This subset includes incidents with an ex-spouse or ex-relationship designation, identified by FBI relationship codes XS and XR. Records involving only current partners do not qualify.
Across the four holidays, 2,907 incidents involved former partners. They already appear in the main measure and receive no additional weight. One incident can involve both current- and former-partner relationships, so the former-partner total should not be subtracted from the overall count.
The national former-partner comparison ranked holidays as follows:

New Year’s Day again had the highest rate. Thanksgiving ranked lowest among incidents involving former partners, while Halloween held that position in the overall holiday analysis. Halloween also ranked slightly above Christmas by rate, despite Christmas having the larger percentage increase. Each holiday has its own baseline, so increases do not determine the rate ranking.
Thanksgiving’s estimated increase requires caution. Its index score was 104.72, with an approximate 95% uncertainty interval of 96.0 to 114.2. Because that interval includes the baseline score of 100, the estimated 4.7% increase does not establish a clear increase.
Washington recorded 56 incidents involving former partners: 23 on New Year’s Day, 14 on Halloween, 10 on Christmas, and 9 on Thanksgiving. These incidents form part of Washington’s total of 239. The relationship labels still do not tell us if a custody dispute, holiday exchange, or shared child was involved.
The 10 Lowest-Graded States in the 2025 Shared-Parenting Report Card
For separated parents, holiday arrangements also depend on the laws governing parenting time. Those rules determine how courts approach a child’s schedule and parental responsibilities. We examined the National Parents Organization’s 2025 Shared Parenting Report Card as a separate legal-policy comparison.
The organization grades statutory support for shared parenting. Its grades do not measure reported violence, children’s well-being, or the quality of individual court decisions. Washington’s C grade concerns its laws; its fifth-lowest eligible incident rate concerns police records. Neither result explains the other.
Mississippi’s entry is now historical. HB 1662, approved April 8, 2026, created a rebuttable presumption favoring joint custody and equally shared parenting time. It applies to initial temporary and initial final custody orders entered after July 1, 2026, rather than modification proceedings. The 2025 grade predates that change.
Kentucky and Washington Use Different Starting Points
Kentucky’s KRS § 403.270 establishes a rebuttable presumption of joint custody and equally shared parenting time, subject to KRS § 403.315. A rebuttable presumption gives the court a starting point that evidence can overcome. It does not guarantee an equal schedule in every case.
The current Kentucky statute also requires courts to consider allegations of domestic violence, abuse, or child abuse or neglect before the other listed factors. That requirement shows why a shared-parenting rule must be considered alongside the provisions addressing a child’s welfare and family safety.
Washington’s RCW § 26.09.187 considers the child’s relationships, caregiving history, emotional and developmental needs, preferences, and parental work schedules. The strength, nature, and stability of the child’s relationships receive the greatest weight. The statute permits substantially equal alternating arrangements when appropriate, without imposing a universal 50/50 schedule.
A Time Allocation Still Needs a Calendar
Parents also need to know what a schedule looks like across an actual week. Several arrangements can divide time equally, yet differ considerably in how frequently a child changes homes. The following are illustrations, rather than claims, about the most common schedules nationally:
- 2-2-3: Two days with each parent, followed by three days with one parent, with the pattern reversing the next week.
- 5-2-2-5: A repeating arrangement with two-day and five-day blocks, commonly keeping designated weekdays consistent.
- Week-on/week–off: A full week in each household before the next exchange.
- 3-4-4-3: Alternating three-day and four-day blocks across a two-week cycle.
A 70/30 or 80/20 allocation gives a proportion of time, but it does not supply a particular calendar. The details still need to account for school, work, travel, and the child’s needs. Equal totals can also produce very different experiences of transitions.
Parenting time describes when a child spends time with each parent. Decision-making authority concerns responsibility for major choices. A regular weekly routine also differs from the holiday terms of an individual order. Equal parenting time alone does not determine Christmas morning, Thanksgiving pickup times, travel arrangements, or where an exchange occurs.
For example, two parents could share time equally throughout the year and alternate a holiday between households. Another arrangement could divide that day into separate blocks. These are calendar choices within an individual parenting plan, requiring more detail than an overall percentage of parenting time.
Holiday Gifts and Everyday Support Tell Different Stories
A child’s holiday experience also depends on how adults handle money. Presents are part of a celebration; groceries, clothes, and diapers support the child’s daily life. Census figures give us a separate view of how frequently custodial parents reported receiving these different contributions from nonresident parents.
Christmas supplied the study’s second-highest national partner incident rate, with 3,194 qualifying incidents and 1.113 per 100,000 covered residents. Our incident extract does not measure gift spending, support compliance, or financial abuse. The Census evidence addresses a different question about household contributions.
In its report Custodial Parents and Their Child Support: 2022, the U.S. Census Bureau reported the following noncash support:

Gifts were reported 16.6 percentage points more frequently than food or groceries. These are 2022 data from the April 2023 Current Population Survey, published in August 2025. Respondents could select multiple answers, so the categories overlap.
What the Gift Comparison Can Tell Us
The gift category combines birthdays, holidays, and other occasions. It does not isolate Christmas, put a dollar value on contributions, or establish that support met a child’s needs. A parent could have provided both gifts and groceries.
The figures do not show parents choosing presents over food, identify anyone who withheld necessities, or connect holiday spending with abuse. They measure how frequently custodial parents reported receiving different types of non-cash support, including gifts, clothing, and groceries.
For a separated family, an agreement about presents leaves other questions to answer. Adults could still need to clarify responsibility for food, clothing, or an existing support obligation. A contribution’s visibility during a celebration tells us little about the full financial arrangement between households.
A new coat, a birthday present, and a bag of groceries each meet a different everyday need. The Census figures show which kinds of support parents reported receiving, but they do not explain the household decisions behind those contributions. That leaves questions about timing, cost, and ongoing responsibilities outside this statistical comparison.
Financial Disagreements and Coercive Control
The circumstances behind a money dispute deserve attention. Parents could disagree over the price of an optional present. A parent could also fail to meet a support obligation. A pattern of financial coercion raises further concerns about a person’s freedom and access to necessities.
Washington’s RCW § 7.105.010 defines coercive control in terms of a harmful pattern that unreasonably interferes with free will and personal liberty. Its examples include deprivation of basic necessities and interference with finances, employment, or services for children. The pattern and its effects are central to that assessment.
The Census figures cannot identify those circumstances inside an individual household. Gift giving, unpaid support, and financial coercion describe different situations, even when money sits at the center of the disagreement. Under Washington law, the conduct and surrounding pattern matter more than the amount spent on a particular holiday purchase.
Children Caught in Conflict and the Limits of Parenting Apps
Children can experience parental conflict through the responsibilities adults ask them to take on. A child might carry messages, listen to criticism, or feel pressure to defend one parent to the other. Research on these experiences helps explain why the way adults communicate deserves attention.
Washington’s 239 qualifying incidents, including 56 involving former partners, establish our reported violence findings. The police records do not identify children’s involvement or exposure. The studies below examine separate populations and cannot tell us what happened to children connected with those incidents.
How Children Experience Divided Loyalties
A review in the 2026 issue of Human Communication Research examined 49 studies involving 23,336 participants. Paul Schrodt found that greater parental conflict was associated with children feeling more caught between their parents, including pressure to take sides.
The research measured several experiences that can signal a child feels caught between parents, including:
- Carrying messages from one parent to the other
- Hearing one parent criticize the other
- Avoiding discussion of one parent in front of the other
- Feeling that loyalty to one parent means betraying the other
These situations can put a child in the middle of an adult disagreement. A child could hesitate to mention an enjoyable visit because of the potential reaction at home. Another could feel responsible for getting an answer about pickup plans. These examples illustrate the research concept; they do not show how frequently these experiences occur during holidays.
The association was stronger in studies involving young adult children than in studies involving adolescents. Studies based on children’s reports also found a stronger relationship between parental conflict and feeling caught than studies relying on parents’ reports. That difference shows why children’s own accounts are an important part of research into divided loyalties.
Distress Can Appear in Several Ways
A separate May 2026 review by Schrodt in Annals of the International Communication Association examined 54 studies involving 25,582 participants. Within that review, an analysis of 47 studies and 20,087 participants linked feeling caught with emotional difficulties, including anxiety, depression, and withdrawal.
Another analysis, covering 22 studies and 14,146 participants, linked feeling caught with outward behavior problems. That research category includes aggression, impulsivity, and hyperactivity. Some studies examined both emotional and behavioral difficulties, which means the groups overlap and should not be added together.
The review did not detect a statistically clear difference in these relationships according to parents’ divorce status. The findings support attention to conflict in separated families and households where parents remain together. They describe associations, without establishing that the feeling caught caused a particular child’s symptoms.
Parent-Child Conversations Deserve Attention
Communication between a parent and child is also relevant. Schrodt’s January 2026 review in Communication Monographs covered 38 studies involving 19,123 participants. It examined how harmful and supportive parent-child communication related to children feeling caught.
Across 31 studies, harmful communication was associated with children feeling caught between parents. Supportive communication was associated with feeling less caught across 14 studies. Some studies examined both types, and the average association with harmful communication was stronger.
The review did not test a particular holiday routine, parenting schedule, or co-parenting app. It cannot tell us that one tool or schedule will reduce conflict. The findings show different relationships between the way parents communicate with children and a child’s sense of being caught between adults.
What Parenting Apps Can Document
Parenting apps can keep messages, schedules, and exchange details in one place. Some platforms also allow courts or other professionals to review communications and check compliance with orders. That kind of record can help show what each person said about a pickup, schedule change, or other parenting arrangement.
A record still does not tell us that conflict has decreased. The same app that stores a pickup agreement can also preserve threats, repeated demands, or unwanted monitoring. The platform documents the communication, but the way someone uses it can still raise safety concerns.
The National Network to End Domestic Violence’s Safety Net Project warns that shared schedules, contact details, and children’s activities can create opportunities for monitoring or harassment by an abusive partner. Its guidance addresses functions and risks. It is not an effectiveness study and supplies no measured reduction in holiday disputes.
Location Sharing and Data Access
A location feature deserves consideration in the context of its purpose. A parent might document arrival at a scheduled exchange through a one-time location share. Continuous location access exposes much more information about that person’s movements. Safety Net identifies greater flexibility in sharing a location at a selected time.
Privacy concerns can also involve account security, location data embedded in photos, third-party access, and how long sensitive information remains stored. Each of those details can affect how much another person can see or collect through the platform, even when the app is being used for routine scheduling, exchanges, or other parenting arrangements.
Washington law also considers how technology is used. Under RCW § 7.105.010, threats, harassment, stalking, or monitoring through technology can form part of coercive control when they are part of a harmful pattern that interferes with a person’s freedom. A parenting app does not change the nature of that conduct.
Holiday Examples of Children Placed in the Middle
The following illustrations describe how adult disagreements could involve children. They are not measured incidents from our study:
- A parent asks a child to negotiate a Christmas pickup change with the other parent.
- A child has to deliver an angry message about Thanksgiving arrangements.
- A parent asks a child to report on the other household’s celebrations.
Each example asks the child to take responsibility for an adult exchange or dispute. Direct adult communication through an appropriate, safe channel can keep a child from carrying those requests. The research supports attention to such pressures, without proving that a particular messaging practice will prevent distress.
Washington’s RCW § 26.09.191 addresses abusive use of conflict, including intentional use of a child in conflict and repeated bad-faith violations of court orders. The law also separates those behaviors from good-faith efforts to protect a parent or child, which matters when safety concerns are part of the dispute.
What the Findings Mean for Washington Families
New Year’s Day had the highest reported rate of partner assault and intimidation among the four holidays we studied, both nationally and in Washington. The state rankings and former-partner findings also showed that holiday patterns did not look the same everywhere or across every relationship.
The research also points to concerns that police data cannot capture on its own. Children can feel caught between parents; gifts, and everyday support meet different needs, and a parenting app cannot resolve coercive control. Holiday arrangements can involve all three at once: safety concerns, the child’s circumstances, and the terms already set out in a parenting plan.
At Dellino Family Law, our work as Seattle child custody lawyers includes helping Washington parents understand parenting plans and address disputes. The findings reinforce the value of arrangements that identify adult responsibilities and consider the child’s needs, without asking children to manage disagreements between households.
Methodology
We analyzed 2025 FBI NIBRS records for New Year’s Day, Halloween, Thanksgiving, and Christmas. Qualifying incidents involved aggravated assault, simple assault, or intimidation linked to selected current or former intimate partners. Attempted and completed offenses qualified, and each incident was counted once. Agencies also had to meet full-year reporting and population criteria.
Rates are based on residents covered by participating agencies, with state rates combining all four dates. States needed at least 80% population coverage and 50 qualifying incidents to be ranked. We applied the same requirements separately to former-partner rankings; 32 states qualified overall, and 12 for that subset.
We compared each holiday with non-holiday dates on the same weekday and within the same calendar quarter, excluding study holidays, adjacent dates, and December 30–31. An index score of 100 represents the matched-day baseline; 150 means 50% above it. State-increase scores weight each holiday equally, and rate rankings use unrounded figures.
The study covers four dates in 2025, not the full holiday season. Reporting differences and unreported incidents can affect results. Records do not identify co-parents, custody disputes, or parenting-time violations, and the findings do not show that holidays caused violence. Legal grades, Census figures, research findings, and technology-safety guidance remain outside the index.
